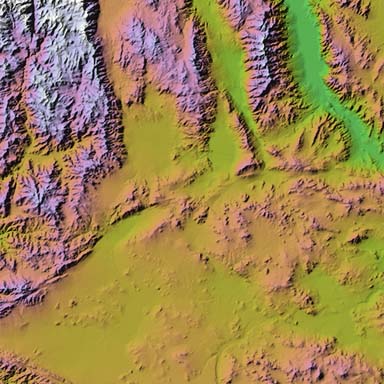
Here is a picture of the area in which I live, taken from several USGS data sets. It was entirely calculated by the software above.
This image is the high desert of southern California; the linear feature at the bottom left is the San Andreas Fault, the groove going from the left edge upwards towards the right is the Garlock fault. Within the bounds of this image are NAWS China Lake, Death Valley (the green feature at upper right), Edwards AFB, Lancaster, Victorville, and Ridgecrest.
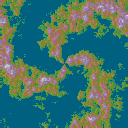
 ridged multifractal in grayscale.